Physical Address
304 North Cardinal St.
Dorchester Center, MA 02124

Today we’ll look at how to monitor your servers performance and troubleshoot slowdowns on Ubuntu 16.04 LTS, 18.04 LTS and 19.04.
We’ll use Nedata for this purpose. With Netdata you can instantly diagnose slowdowns and anomalies in your infrastructure with thousands of metrics, interactive charts, and health alarms.
To install Netdata simply issue the following command at the terminal:
bash <(curl -Ss https://my-netdata.io/kickstart.sh)
The installation script will prompt you to install its dependencies.
To start the service issue the following at the terminal:
service netdata start
Once the installation is complete, make sure the port 19999 is allowed in your firewall, launch your browser and go to the IP of your server followed by the port number. Example:
http://192.168.0.106:19999
If everything went well, you should be seeing graphs reporting the performance of your server:
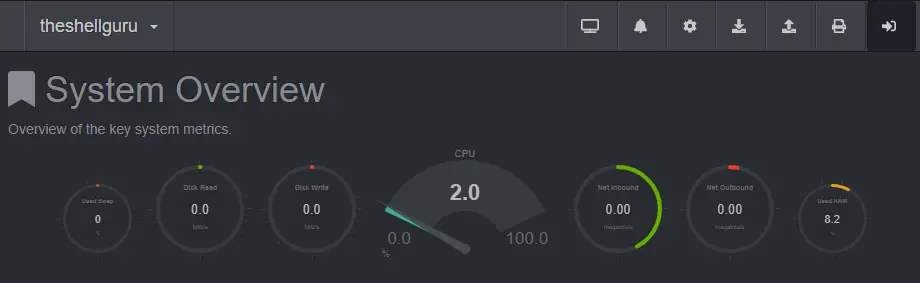
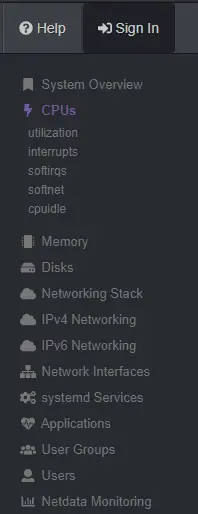
If you look at the right side of the screen, you should see metrics for the different components of your server: CPU, Memory, and Disk to name a few. Scroll through them and you’ll get timed charts to identify and locate possible problems.
That’s it, you’re done!